
Some of us are lucky enough to live along the coast of Nova Scotia. But with that privilege comes the worry of how sea-level rise and storm surge will impact our properties. When will sea-level rise start to threaten your land? What sort of storm surge and tidal conditions would actually cause your property to flood?
|
If you live on the shorelines of Mahone Bay, Lunenburg, Blue Rocks, Yarmouth, or Digby, these 3D Interactive Flood Map Models can help you answer those questions and take control of those stressful unknowns in the face of climate change.
The map models will help municipal planning and development departments make better-informed decisions about coastal development. These powerful models can visualize the risk and threat levels to our infrastructure and road networks. Incorporating this information into emergency and disaster planning is critical for all of us in the face of climate change. |
|
We partnered with the map creators, 3D Wave Design, to provide these maps to the Town of Lunenburg, the Town of Mahone Bay, the Municipality of the District of Yarmouth, and the Municipality of the District of Digby. Explore the maps to learn more about the impacts of tides, storm surges, and sea-level rise on these coastal communities.
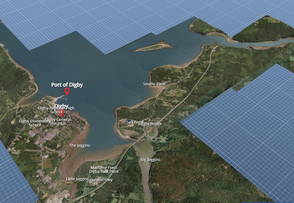
Map for the Municipality of the District of Digby
|
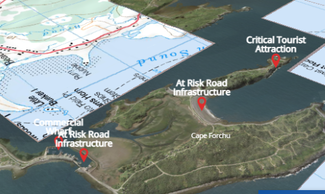
Map for the Municipality of the District of Yarmouth
|
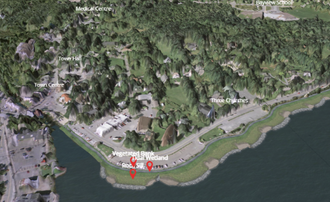
Map for the Town of Mahone Bay
|
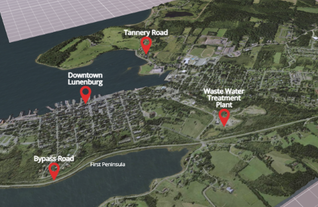
Map for the Town of Lunenburg
|
thanks to our funders

|
|

|
Thanks to our project partners

|

|

|
|
|
|
For more information, please contact jordan@coastalaction.org